This post supersedes http://false.ekta.is/2012/05/using-netbeans-for-stm32-development-with-stlink-texane/ it has been updated for 2016 and current best software tools. Again, this is only focussed on a linux desktop environment.
Required pieces haven’t changed much, you still need:
- A tool chain.
- GDB Server middleware (OR just a tool flashing if you want to live in the dark ages)
- A “sexy” IDE (If you disagree on wanting an IDE, you’re reading the wrong post)
Getting a toolchain
New good advice
Advice here hasn’t changed. The best toolchain is still gcc-arm-embedded They steadily roll out updates, it’s the blessed upstream of all ARM Cortex GCC work, and it has proper functional multilib support and proper functional documentation and bug reporting. It even has proper multi platform binaries for windows and macs. Some distros are packaging “arm-none-eabi-XXXXX” packages, but they’re often old, repackages of old, poorly packaged or otherwise broken. As of November 2015 for instance, ArchLinux was packaging a gcc 5.2 binary explicitly for arm-cortex, that did not support the -mmcu=cortex-m7 option added in gcc 5.x series. Just say no.
I like untarring the binaries to ~/tools and then symlinking to ~/.local/bin, it avoids having to relogin or start new terminals like editing .bashrc and .profile does.
~/.local/bin$ ln -s ~/tools/gcc-arm-none-eabi-5_2-2015q4/bin/arm-none-eabi-* .
Old bad advice
The internet is (now) full of old articles recommending things like “summon-arm-toolchain” (Deprecated by the author even) “code sourcery (lite)” (CodeSourcery was bought by Mentor, and this has been slowly killed off. Years ago, this was a good choice, but all the work they did has long since been usptreamed) You can even find advice saying you need to compile your own. Pay no attention to any of this. It’s well out of date.
GDB Server middleware
New good advice
Get OpenOCD. Make sure it’s version 0.9 or better. 0.8 and 0.7 will work, but 0.9 is a _good_ release for Cortex-M and STM32 parts. If your distro provides this packaged, just use it. Fedora 22 has OpenOCD 0.8, Fedora 23 has OpenOCD 0.9. Otherwise, build it from source
Old bad advice
Don’t use texane/stlink. Just don’t. It’s poorly maintained, regularly breaks things when new targets are introduced and not nearly as flexible as OpenOCD. It did move a lot faster than OpenOCD in the early days, and if you want a simpler code base to go and hack to pieces for this, go knock yourself out, but don’t ask for help when it breaks.
Netbeans
No major changes here, just some updates and dropping out old warnings. You should still setup your toolchain in netbeans first, it makes the autodetection for code completion much more reliable. I’ve updated and created new screenshots for Netbeans 8.1 the latest current release.
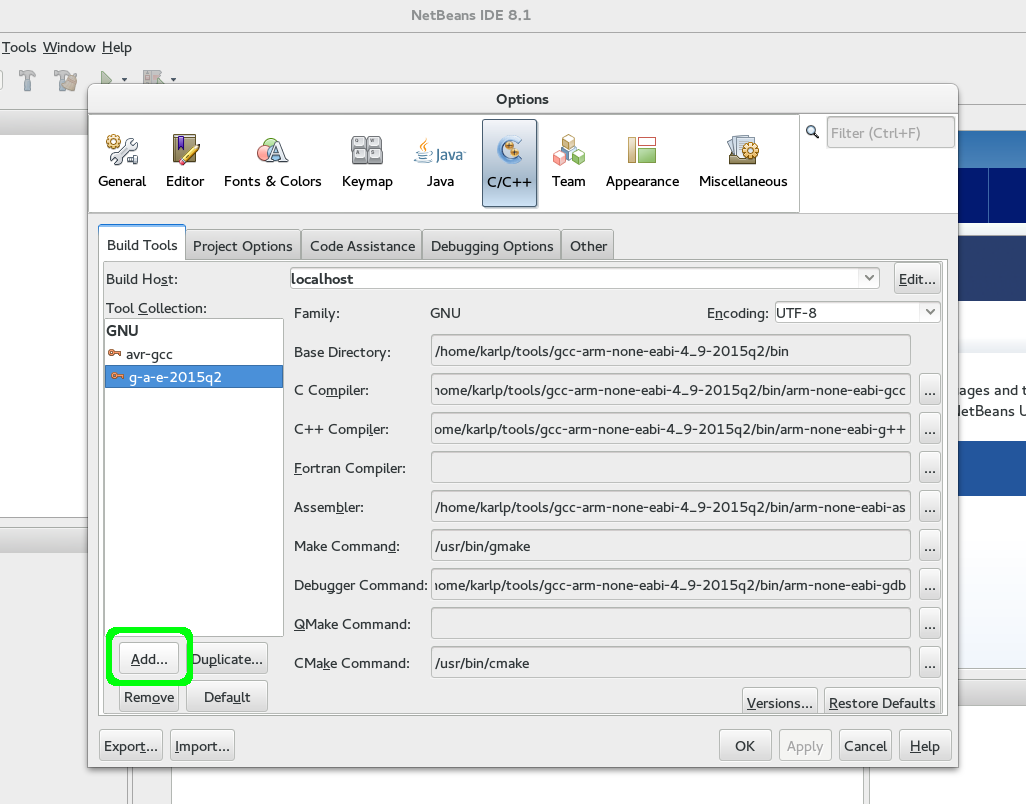
First, go to Tools->Options->C/C++->Build Tools and Add a new Toolchain…

Adding a new toolchain to netbeans
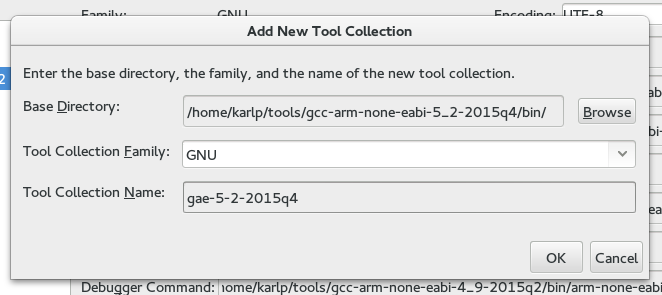
Put in the “Base directory” of where you extracted the toolchain. In theory netbeans uses the base directory and the “family” to autodetect here, but it doesn’t seem to understand cross tools very well.
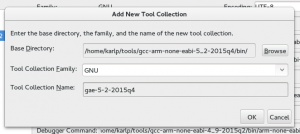
Base path for new toolchain and name
Which means you’ll have to fill in the names of the tools yourself, as shown below. Click on “Versions” afterwards to make sure it all works.
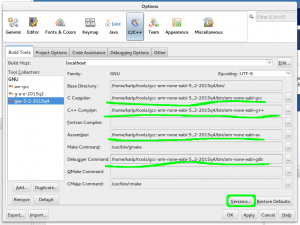
Adding explicit paths to netbeans toolchains
“Versions” should show you the right thing already, as shown
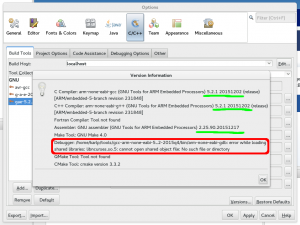
Versions from our new toolchain (and an error from gdb we must fix)
If you’re getting the error about ncurses from gdb, this because newer gdb builds include the curses “tui” interface to gdb in the standard build. (Yay! this is a good thing!) However, as the g-a-e toolchains are all provided as 32bit, you may be missing the 32bit ncurses lib on your system. On Fedora, this is provided in the ncurses-libs.i686 package.
Ok, now time to build something. This is your problem, I’m going to use one of the libopencm3 test programs right now, specifically, https://github.com/libopencm3/libopencm3/tree/master/tests/gadget-zero (the stm32l1 version)
Programming your device
Netbeans doesn’t really have any great way of doing this that I know of. You can use build configurations to have “run” run something else, which works, but it’s a little fiddly. I should spend more time on that though. (See later for a way of doing it iteratively via the debugger console in netbeans)
In the meantime, if you just want to straight out program your device:
$ openocd -f board/stm32ldiscovery.cfg -c "program usb-gadget0-stm32l1-generic.elf verify reset exit"
No need for bin files or anything, there’s a time and a place for those, and if you don’t know and can explain why you need bin files, then elf files are just better in every way.
Debugging your part
GDB is always going to be a big part of this, but, assuming you’ve got it flashed, either by programming as above, then you can debug in netbeans directly. First, make sure OpenOCD is running again, and just leave it running.
$ openocd -f board/stm32ldiscovery.cfg
First, install the gdbserver plugin, then choose Debug->Attach Debugger from the menu.
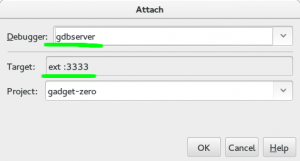
Attach to a gdbserver
- Make sure that you have “gdbserver” as the debugger type. (Plugin must be installed)
- Make sure that you have “ext :3333” for the target. By default it will show “remote host:port” but we want (need) to use “extended-remote” to be able to restart the process. (See the GDB manual for more details)
- Make sure that you have the right project selected. There’s a bug in the gdbserver plugin that always forgets this.
At this point, “nothing” will happen. If you look at the console where OpenOCD is running, you’ll see that a connection was received, but that’s it.
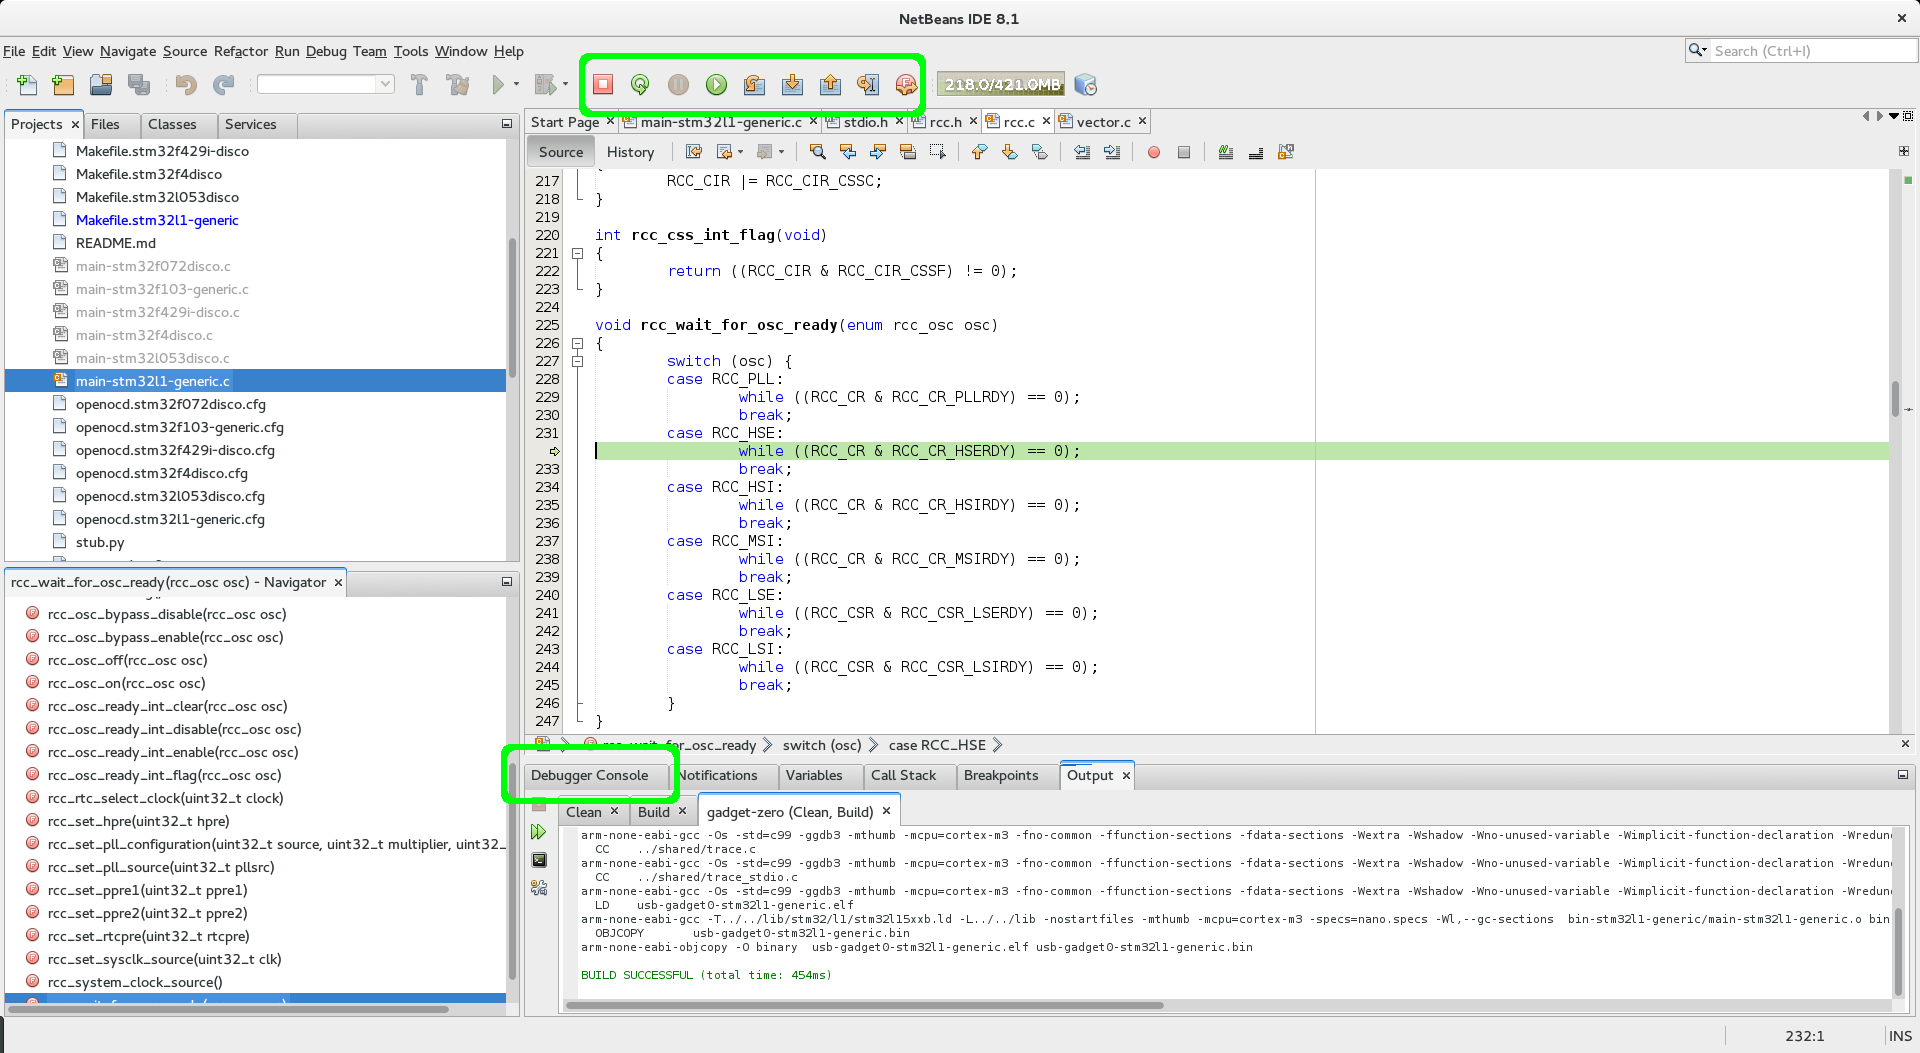
Press the “Pause” button, and you will stop execution wherever the device happened to be, and netbeans will jump to the line of code. In this example, it’s blocked trying to turn on HSE, as there’s no HSE fitted on this board:
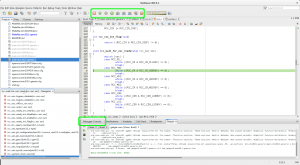
Source debugging in netbeans via OpenOCD
If you now set a breakpoint on “main” or anywhere early and press the “Restart” icon in the top, OpenOCD will restart your process from the top and stop at the first breakpoint. Yay! If restart fails, make sure you used “extended-remote” for the target!
Bonus
If you click the “Debugger console” window, you can actually flash your code here too. Leave the debugger running! (No need to stop the debugger to rebuild) Make a change to your code, rebuild it, and then, on the “Debugger console” just enter “load” and press enter. You’ll see the OpenOCD output as it reflashes your device. As soon as that’s done, just hit the “Restart” icon in netbeans and start debugging your new code!