CPU Profiling applications on OpenWrt with perf or oprofile

I have a problem were two applications running on an OpenWrt router are using too much CPU time. I can reproduce the problem fairly well, but I don’t have any easy obvious clues as to the cause yet. Worse, it’s behaves more like a memory leak. The task stays the same, but CPU usage slowly creeps up over an hour or so. I’ve tried setting up the same applications on a linux desktop, and I can make it happen, but it’s so very very slow. So while that was running, I looked into CPU profiling on linux, and particularly, which of them would run on OpenWrt. So immediately things like valgrind/cachegrind and dtrace and friends are ruled out. I scratched google cpu profiler as being too invasive, and gprof as having too many criticisms. Also, I’d never used any of these tools before, and I didn’t want to spend all day testing them individually. Searching for CPU profiling linux kept turning up two applications, oprofile and perf. First step then was, “which of these, if any, is already packaged for OpenWrt?”

Background requirements / assumptions

  • You’re building your own OpenWrt images here…
  • I started testing this on Backfire, but then moved to Attitude Adjustment when I started working with perf.
  • You are free to recompile the code under test, and aren’t trying to test a live system

Turns out the both are, but you have to jump some hoops. In “make menuconfig“, you need to got to “Gobal build settings” and enable “Compile the kernel with profiling enabled“. That’s all you need for oprofile, but for perf, go also to “Advanced configuration options (for developers)” and enable “Show broken platforms / packages“. I’m working on the atheros platform (ar2317), and apparently (I’m told on IRC) it’s a packaging problem more than a broken tool. It works on atheros at least, YMMV.

Continuing, you need to turn on the libelf1 library under “Libraries“, because the perf package doesn’t select it properly for you. Finally, under “Development” enable oprofile, perf or both. (When I started this, I didn’t have BROKEN packages enabled, so just used oprofile, and later used perf. If perf works, I’d only use perf, and skip oprofile altogether. I won’t talk about oprofile any further, but this was all you needed to get it to work)

So, that will make an image that can run the tools, but all binaries are (rightfully) stripped on OpenWrt by default in the build process, so you won’t get particularly useful results. In theory, you can record performance data on the router, and then generate the reports on your linux desktop with all the symbols, but I never worked out how to do this.

So, we want to run non-stripped binaries for anything we want to actually investigate. One way of doing this is the following magic incantation in your OpenWrt buildroot (Provided by jow_laptop on IRC)

make package/foo/{clean,compile} V=99 CONFIG_DEBUG=y

You can then copy the binary from [buildroot]/staging_dir/target-arch_uClibc-0.x.xx.x/root-platform/usr/bin/foo onto your device and run it. Actually, if you only want to analyse a single program, that may be enough for you. You can copy that non-stripped binary to the ramfs on /tmp, and just start profiling…

$ start_your_program
# capture 120 seconds worth of profiling data
$ perf record -p $(pidof your_program) sleep 120
# wait…
$ perf report

If your program actually runs to completion, rather than being a daemon of some sort, you can just use “perf record your_program”. This may actually give you enough information. Lucky you!

Here’s an example of recording a stripped binary, and recording a non-stripped binary. (This is a real program, but it’s not the point here.)

# Overhead  Command           Shared Object  Symbol
# ........  .......  ......................  ......
#
    59.34%  mlifter  [kernel]                [k] 0x800cd150
    25.04%  mlifter  libuClibc-0.9.33.2.so   [.] 0x37990 
     5.17%  mlifter  libgcc_s.so.1           [.] 0xaaa4  
     2.96%  mlifter  libpthread-0.9.33.2.so  [.] 0xfe54  
     1.68%  mlifter  libjson.so.0.0.1        [.] 0x4e00  
     1.25%  mlifter  [nf_conntrack]          [k] 0x22e4  
     0.87%  mlifter  libmosquitto.so.1       [.] 0x17d0  
     0.87%  mlifter  ld-uClibc-0.9.33.2.so   [.] 0x1478  
     0.64%  mlifter  mlifter                 [.] 0x6bac  
     0.61%  mlifter  [ip_tables]             [k] 0x5c8   
     0.26%  mlifter  libuglylogging.so       [.] 0x96c   
     0.26%  mlifter  libmodbus.so.5.0.0      [.] 0x2e60  
     0.23%  mlifter  [xt_conntrack]          [k] 0x2d0   
     0.20%  mlifter  [nf_conntrack_ipv4]     [k] 0x320   
     0.15%  mlifter  libcrypto.so.1.0.0      [.] 0x84e58 
     0.12%  mlifter  [iptable_raw]           [k] 0       
     0.12%  mlifter  [iptable_nat]           [k] 0x170   
     0.09%  mlifter  libuci.so               [.] 0x2cec  
     0.06%  mlifter  [nf_nat]                [k] 0x5e4   
     0.03%  mlifter  [nf_defrag_ipv4]        [k] 0x34    
     0.03%  mlifter  [iptable_mangle]        [k] 0xe0    
     0.03%  mlifter  [iptable_filter]        [k] 0x40    

And here’s the same thing, non-stripped

# Overhead  Command           Shared Object                         Symbol
# ........  .......  ......................  .............................
#
    59.29%  mlifter  [kernel]                [k] 0x800780e0
    26.30%  mlifter  libuClibc-0.9.33.2.so   [.] 0x39ff0 
     5.66%  mlifter  libgcc_s.so.1           [.] 0xa154  
     2.83%  mlifter  libpthread-0.9.33.2.so  [.] 0xaa20  
     1.70%  mlifter  libjson.so.0.0.1        [.] 0x4b54  
     0.85%  mlifter  [nf_conntrack]          [k] 0x6020  
     0.60%  mlifter  [ip_tables]             [k] 0x630   
     0.58%  mlifter  libmosquitto.so.1       [.] 0x39cc  
     0.47%  mlifter  ld-uClibc-0.9.33.2.so   [.] 0x29f0  
     0.23%  mlifter  libuglylogging.so       [.] 0x7d0   
     0.19%  mlifter  libmodbus.so.5.0.0      [.] 0x55cc  
     0.19%  mlifter  [nf_conntrack_ipv4]     [k] 0x2fc   
     0.17%  mlifter  mlifter                 [.] 0x1880  
     0.17%  mlifter  libcrypto.so.1.0.0      [.] 0x35b7c 
     0.15%  mlifter  mlifter                 [.] msg_add_branch_readings_full
     0.15%  mlifter  [xt_conntrack]          [k] 0xb0    
     0.15%  mlifter  [iptable_nat]           [k] 0x360   
     0.06%  mlifter  [iptable_filter]        [k] 0x40    
     0.04%  mlifter  mlifter                 [.] run_tasks
     0.04%  mlifter  mlifter                 [.] sfw_read_smart_bar
     0.04%  mlifter  [nf_defrag_ipv4]        [k] 0x54    
     0.02%  mlifter  mlifter                 [.] sfw_provides_circuit_readings
     0.02%  mlifter  mlifter                 [.] publish_backoff
     0.02%  mlifter  mlifter                 [.] sfw_verify_modbus_connection
     0.02%  mlifter  mlifter                 [.] task_modbus_poll
     0.02%  mlifter  mlifter                 [.] task_check_state_complete
     0.02%  mlifter  [nf_nat]                [k] 0x610   
     0.02%  mlifter  [iptable_mangle]        [k] 0x50    
     0.02%  mlifter  [fuse]                  [k] 0x70c   

Not much of a difference. We can see calls into our own code, but well, we don’t spend much time there :) Really, to get useful output, you need non-stripped libraries, and the kernel symbols. You’re never going to fit all of that on a ramdisk on your OpenWrt router. It’s time for some remote filesystems.

I used sshfs for this, which was very easy to setup, but it’s pretty cpu heavy on a small router. NFS probably would have been a better choice. However you do it, mount your OpenWrt buildroot somewhere on your router.

Then, even without any changes in how you call your application, you can add the kernel symbol decoding, just add the -k parameter. “perf report -k /tmp/remote/build_dir/linux-atheros/linux-3.3.8/vmlinux” Now we get the kernel chunks broken out, like in this snippet.

# Overhead  Command           Shared Object                             Symbol
# ........  .......  ......................  .................................
#
    26.30%  mlifter  libuClibc-0.9.33.2.so   [.] 0x39ff0 
     5.85%  mlifter  [kernel]                [k] finish_task_switch.constprop.58
     5.68%  mlifter  [kernel]                [k] __queue_work
     5.66%  mlifter  libgcc_s.so.1           [.] 0xa154  
     4.07%  mlifter  [kernel]                [k] n_tty_write
     2.83%  mlifter  libpthread-0.9.33.2.so  [.] 0xaa20  
     2.83%  mlifter  [kernel]                [k] __wake_up
     2.41%  mlifter  [kernel]                [k] tty_write
     1.85%  mlifter  [kernel]                [k] handle_sys
     1.70%  mlifter  libjson.so.0.0.1        [.] 0x4b54  
     1.58%  mlifter  [kernel]                [k] fsnotify
     1.57%  mlifter  [kernel]                [k] put_ldisc
     1.30%  mlifter  [kernel]                [k] vfs_write
     0.94%  mlifter  [kernel]                [k] tty_insert_flip_string_fixed_flag
     0.91%  mlifter  [kernel]                [k] __do_softirq
     0.91%  mlifter  [kernel]                [k] memcpy

We’re still missing symbols from uClibc, and any other user libraries we may call. (like libjson there) Fortunately, when we rebuilt our package with CONFIG_DEBUG=y earlier, it rebuilt the libraries it depends on in debug too. But now, we need to make sure we call our binary using the correct debug libraries. (This is the bit I think should be doable offline, but this is the way I got it to work at least!)

This is setting up the library path to use the non-stripped libraries. We then start perf using this process ID. (/tmp/remote is where I mounted my OpenWrt buildroot)

$ LD_LIBRARY_PATH=/tmp/remote/staging_dir/target-mips_uClibc-0.9.33.2/root-atheros/lib:/tmp/remote/staging_dir/target-mips_uClibc-0.9.33.2/root-atheros/usr/lib /tmp/remote/staging_dir/target-mips_uClibc-0.9.33.2/root-atheros/usr/bin/mlifter

And now we can see all the details….

# Overhead  Command           Shared Object                             Symbol
# ........  .......  ......................  .................................
#
     6.39%  mlifter  [kernel]                [k] finish_task_switch.constprop.58
     5.83%  mlifter  [kernel]                [k] __queue_work
     5.01%  mlifter  libuClibc-0.9.33.2.so   [.] _ppfs_parsespec
     3.98%  mlifter  [kernel]                [k] n_tty_write
     3.27%  mlifter  libuClibc-0.9.33.2.so   [.] _vfprintf_internal
     3.24%  mlifter  [kernel]                [k] __wake_up
     2.77%  mlifter  libuClibc-0.9.33.2.so   [.] __libc_write
     2.48%  mlifter  [kernel]                [k] tty_write
     1.60%  mlifter  [kernel]                [k] vfs_write
     1.60%  mlifter  [kernel]                [k] put_ldisc
     1.57%  mlifter  [kernel]                [k] fsnotify
     1.53%  mlifter  libuClibc-0.9.33.2.so   [.] _fpmaxtostr
     1.45%  mlifter  [kernel]                [k] handle_sys
     1.31%  mlifter  libgcc_s.so.1           [.] __muldf3
     1.11%  mlifter  libuClibc-0.9.33.2.so   [.] __stdio_WRITE
     1.08%  mlifter  [kernel]                [k] tty_insert_flip_string_fixed_flag
     1.06%  mlifter  libgcc_s.so.1           [.] __unpack_d
     1.04%  mlifter  libuClibc-0.9.33.2.so   [.] __stdio_fwrite
--- snip ---
     0.19%  mlifter  libjson.so.0.0.1        [.] json_object_put
--- snip --- 
     0.11%  mlifter  libjson.so.0.0.1        [.] json_object_double_to_json_string

We can now see into uClibc, and into user libraries like libjson. (Trust me, I just didn’t include _alllll_ the output.) This is not actually the same point in the program, so don’t read too much into the actual numbers here. If you want, you can comment that this program is spending far too much time printing something to the console. (which is true!)

That’s it. You can now get symbol level information on what’s happening and how much. Whether this is useful is a different story, but this was fairly complicated to setup and test out, so I thought this might be helpful to others at some point.
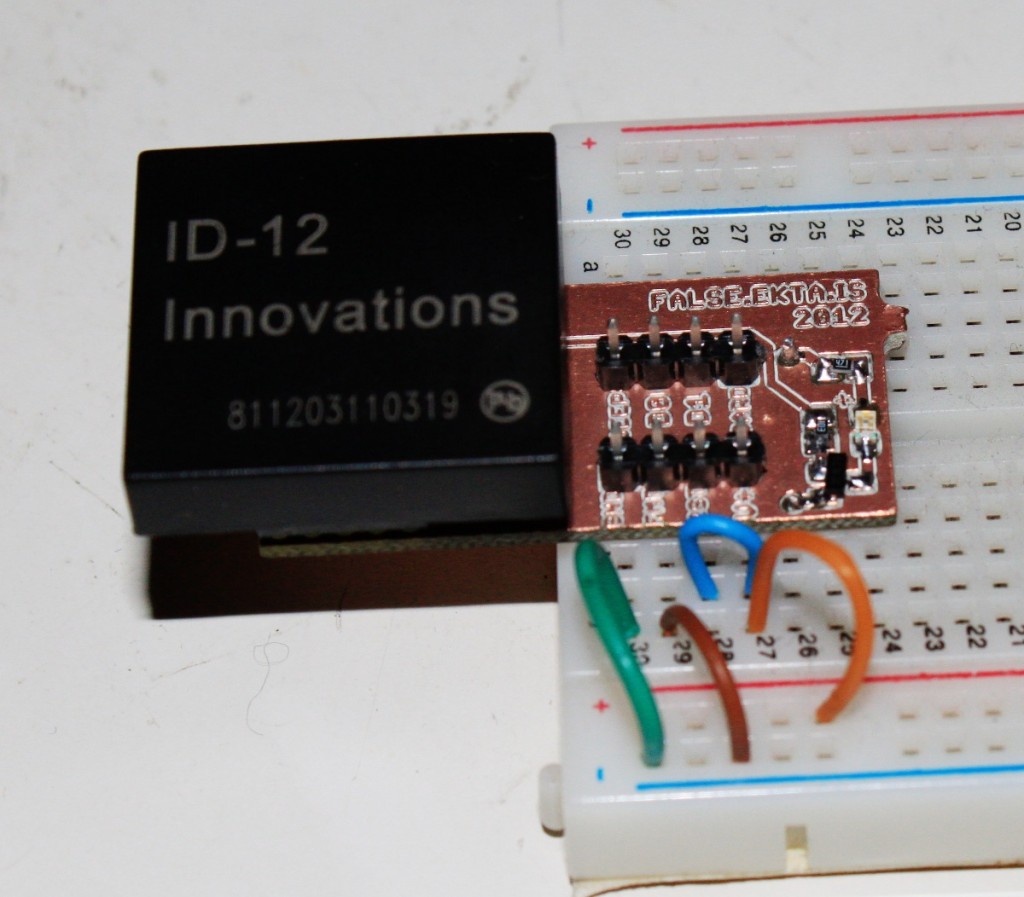
ID12 RFID breakout board

Some time ago I got an ID12 RFID reader module from Sparkfun, during their free day. I had some 2mm socket headers lying around from an xbee project, and finally got around to trying this thing out. Sparkfun sells a “breakout”, but in my mind it’s a bit of a failure, as it takes up too much space for easily mounting on a breadboard.

So, I made my own.
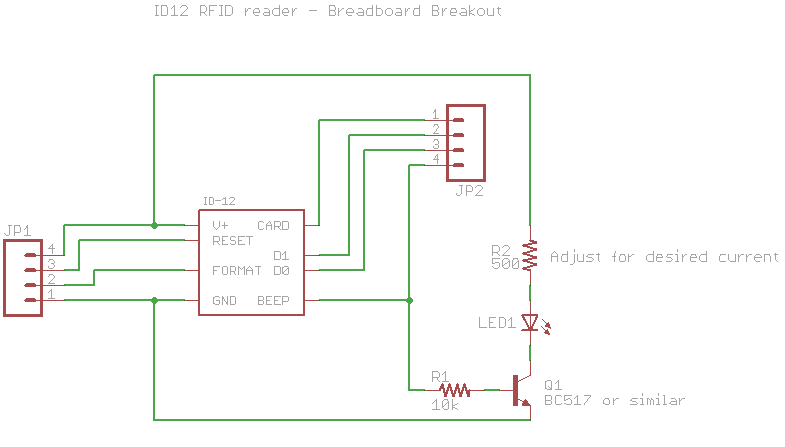
ID12 RFID Breadboard friendly breakout

I integrated the LED indicator of a successful read onto the board, and only the useful headers for the ID12 and ID20 modules. It’s much narrower, so easier to use on a breadboard. My board is only ~39mm x 19mm, designed to fit over the channel on a regular breadboard, yet still leave space for plugging wires in. Sparkfun’s is 25mm x 25mm. There’s not much too the design really,

This board was laid out to be made on a milling machine, so there’s no silkscreen text, it’s all in the copper layer instead, and it avoids assuming plated through holes, but it would work just fine manufactured normally. The LED circuit is surface mount, but you can ignore that completely by just not populating those parts.

You can get the eagle files in my github repository

Consider the license to be public domain, or your choice of BSD/MIT/X11.

I’ve only found one RFID card in my wallet that it can actually read, turns out there’s more rfid standards than I thought!

Installing Eagle (5.12) on Fedora 17 (64bit)

Eagle is only provided as a 32bit package for linux, even as of version 6.3. I’m still using 5.x, for compatibility reasons, so I was trying to get it installed on my newish Fedora 17 64 bit install. Eagle’s #1 FAQ item is how to do this, but it’s for fedora 10, and some of the packages have changed. You also don’t need to install as many, as some of them will be pulled in as dependencies.

  • glibc.i686
  • libXrender.i686
  • libXrandr.i686
  • libXcursor.i686
  • freetype.i686
  • fontconfig.i686
  • libXi.i686
  • libpng-compat.i686
  • libjpeg-turbo.i686
  • libstdc++.i686
  • openssl-devel.i686

There, much better.
Updated with corrections 2013-Nov-18

Automatic OpenWRT builds and conflicting package versions

I’m doing some automated builds of OpenWRT here, and was running into problems with the .config file, package dependencies and versions across multiple feeds. Specifically, I have a very very tiny .config file that lists a package and platform, and that pulls in just about everything else it needs. However, depending on the order of feed update and install, (And particularly, when using ./scripts/feeds/install -a) the wrong version of one of the dependencies was being pulled in.

Now, if all feeds were instantly and magically updated in the OpenWRT upstream repository, this wouldn’t be a problem of course :) Unfortunately, that problem isn’t going away, so what to do?

Well, basically, get simpler. Originally I had a giant .config file copied out of a manually configured buildroot, a feeds.conf with all sources, and the build script ran

  1. ./scripts/feeds/update -a && ./scripts/feeds/install -a
  2. make -j5 V=s

That way’s crap. The new way runs with a much much much smaller .config file, onyl about 10 lines (enough to specify the platform, a “master” package that depends on what we want, and one or two things we explicitly don’t want) Then, it’s a matter of calling feeds install -p feedname -a IN ORDER so that if there’s a package in one feed that depends on a package in another feed, that the dependency’s feed is installed first.

Specifically, this happened here when our “master” project depended on mosquitto, which is both in the stock feed for trunk, (at v0.15) as well as in the company maintained public feed (at v1.0.3) The order of the install -a call was pulling in the mosquitto dependency from trunk first.

So, the new cool way…

  1. cp tiny.config .config
  2. ./scripts/feeds update -a
  3. ./scripts/feeds install -a -p owrt_pub_feeds
  4. ./scripts/feeds install -a -p private_feeds
  5. make defconfig
  6. make -j5 V=s

Much better.

Endless polling ajax gotchas with recursive calls

There’s a pretty good piece on how to make your page continually update over here which works pretty well. With one problem. In my mind, a rather major problem. If you ever have an exception in the success, error or complete handlers inside the $.ajax() call, javascript error handling junks the rest of the function, and you never make the recursive call.

Old and Busted

(function loopsiloop() {
   setTimeout(function() {
       $.ajax({
           url: 'foo.htm',
           success: function(response) {
               // BANG! TypeError Cannot read property 'xxx' of null
               console.log(response.expected_property);
           },
           complete: function() {
               // Only works if success didn't throw an exception
               loopsiloop();
           }
       });
   }, 5000);
})();

In certain conditions, jquery’s success handler gets called with what could hardly be called a successful response. Maybe you got a 404 page instead of the json you were expecting, or whatever. Fair bet that your handler code wasn’t expecting that. Fair bet that it was actually transient (rebooting the server for instance) Fair bet that you actually want it to just try again in five seconds.

Well, sucks to be you, but the first time your success handler throws any sort of exception, javascript just ate your function.

New and Sexy

Use jQuery’s deferred objects

(function loopsiloop_sexy() {
        setTimeout(function() {
            $.ajax({
                 url: 'foo.htm',
                success: function(response) {
                    // BANG! (we didn't stop it throwing TypeErrors)
                    console.log(response.expected_property);
                }
            }).always(function() {
                // This will always be called, regardless of exceptions in the ajax call
                loopsiloop_sexy();
            });
        }, 5000);
    })();

Note that the .always call is outside the anon function that $.ajax is calling. So now, even when your success/error/complete methods explode, you haven’t broken the endless loop. And as soon as your server starts serving what you expected again, it all starts working again. Yay!

Joining linux to an AD domain for DNS

So, we have an ActiveDirectory domain at work “blah.local” on some sort of microsoft small business server or something. We also have a pile of linux virtual machines where all the fun stuff happens. They get IPs and external network connections and DNS resolution just fine from the windows DHCP/DNS server, but the machine names never get registers in DNS anywhere, so all of us internal users have to try and remember which IP address is which machine.

This is actually easy to fix, but it’s a little unusual. First, you will neeed the username and password of a user with domain admin rights. (You only need this to join the machine to the domain in the first place)

$ sudo apt-get install likewise-open
$ sudo domainjoin-cli join blah.local karlp
Joining to AD Domain:   blah.local
With Computer DNS Name: tinyweb.blah.local

karlp@BLAH.LOCAL's password: 
SUCCESS
You should reboot this system before attempting GUI logins as a domain user.
$ sudo lw-update-dns 
A record successfully updated in DNS
PTR records successfully updated in DNS
$ cowsay 'profit!!!!!'
 ____________
< profit!!!! >
 ------------
        \   ^__^
         \  (oo)\_______
            (__)\       )\/\
                ||----w |
                ||     ||
$

You’ll now be able to use the machine names from any other machine in the network that’s using the windows dns server

Eclipse 4.2, Lua and execution environments

One of the things that made me want to go and try eclipse again was this advertised Lua Development Toolkit, the LDT. (aka Koneki, have I mentioned how much I hate eclipse’s acronym+codename soup?) Apparently I could develop Lua scripts in eclipse, with syntax highlighting, debugging, documentation and all that good stuff.

So, I made a simple script. I didn’t get any help/luadoc. I did get syntax highlight, but I get that in vim too. Oh, and there’s no “run” configuration. Umm, that’s kinda important. I didn’t set up an “execution environment” because well, I just wanted to use the system lua. Seems that you actually must set up an execution environment so that it knows how to run things and do the luadoc. Except, it’s just some magical zip file. Which is not provided by default and has no documentation on what it should contain.

So yeah, good fucking luck actually using this advertised feature of the Lua Development Toolkit. Another excellent fucking release from eclipse. I try to like eclipse, I try to use it, but for fucks sake.

Code Size changes with “int” on 8bit and 32bit platforms

I was looking for a few bytes extra flash today, and realized that some old AVR code I had, which used uint8_t extensively for loop counters and indexes (dealing with small arrays) might not be all that efficient on the STM32 Cortex-M3.

So, I went over the code and replaced all places where the size of the counter wasn’t really actually important, and made some comparisons. I was compiling the exact same c file in both cases, with only a type def changing between runs.

Compiler versions and flags

platform gcc version cflags
AVR avr-gcc (GCC) 4.3.5 -DNDEBUG -Wall -Os -g -ffunction-sections -fdata-sections -Wstrict-prototypes -mmcu=atmega168 -funsigned-char -funsigned-bitfields -fpack-struct -fshort-enums
STM32 arm-none-eabi-gcc (GNU Tools for ARM Embedded Processors) 4.6.2 20120316 (release) [ARM/embedded-4_6-branch revision 185452] -DNDEBUG -Wall -Os -g -ffunction-sections -fdata-sections -Wstrict-prototypes -fno-common -mcpu=cortex-m3 -mthumb

And… here’s the results

counter type avr-size arm-none-eabi-size
unsigned int 1318 844
uint8_t (original) 1160 856
uint_least8_t 1160 856
uint_fast8_t 1160 844
int 1330 820
int8_t 1212 872
int_least8_t 1212 872
int_fast8_t 1212 820

I would personally say that it looks like ARM still has some work to go on optimizations. If _least8 and _fast8 take up more space than int it’s not really as polished as the avr-gcc code yet. For me personally, as this code no longer has to run on both AVR and STM32, I’ll just use int.

So, after extending this a bit, my original conclusion about the fast_ types not being fully optimized with arm-gcc were wrong. It’s more that, on AVR, your “don’t care” counters should be unsigned for smaller size, while on STM32, they should be signed (Though I still think it’s dodgy that int_least8_t resulted in bigger code than int_fast8_t) Also, even if signed is better in the best case, the wrong signed is also the worst case. Awesome.

Eclipse 4.2 spell check and user dictionaries.

So, there’s this bug: https://bugs.eclipse.org/bugs/show_bug.cgi?id=310237

Which is fine and all, I can switch to the c/c++ spelling check section. But this fails to address the massive fucking pile of fail this is. WHY ON EARTH IS THERE A SEPARATE SPELL CHECK SETTING FOR C/C++?!

I mean, why?! This is not like formatting and tabs where you might want different per language settings. But spell check settings based on whether I’m in C, python, java or lua?! HELL NO!

Eclipse 4.2 Juno and C projects detecting include paths

Eclipse moved from 3.7 right up to 4.2, and it includes Lua now as well, so I thought I’d have a quick go at trying it out on some C projects again. It was less than awesome, but well, that’s eclipse I guess.

I chose File->New->”Makefile project with existing sources”, and selected the path to my project. I can’t find a combined “clean and build” but I cleaned and built, and it all mostly sort of worked.

Except, it completely failed to recognise the -I and -L flags from my Makefile. Which are important. That’s why they’re there. So, it builds, but you can’t navigate to any of the libraries you’re using, and your screen is full of red errors about undefined fields.

Under Project Properties->C/C++ build->Discovery options, there’s an unchecked setting for “Automate discovery…” but checking it just produces a warning that this is deprecated, and to use, “Preprocessor include paths, macros, etc” Good fucking job eclipse. Why have an option that you’ve decided to remove.

So, Project Properties->C/C++ General->Preprocessor include paths… (What’s the difference between build and general? fuck knows, classic eclipse UI design) And then “CDT GCC Build Output Parser”

Now, I never would have actually found this, but they have this pattern that’s apparently meant to help it find the calls to GCC in the makefile output. The default is (gcc)|([gc]\+\+)|(clang)

Now, on linux, by default, “cc” is gcc. and if you don’t override the CC variable in your own makefile, it will be invoked as cc. Which eclipse then completely ignores. I know that it’s not a good idea to always assume that cc is gcc, but hey, if it detected nothing when I ran the build, perhaps it should offer some other alternatives? Perhaps it should try and run cc and look at it’s version? Perhaps it should follow the symlinks?

If you want to fix it, use this text instead (gcc)|([gc]\+\+)|(clang)|(cc)
Then do a clean, a build, then right click your project, chose index, and choose rebuild.

Presto. The eclipse way.