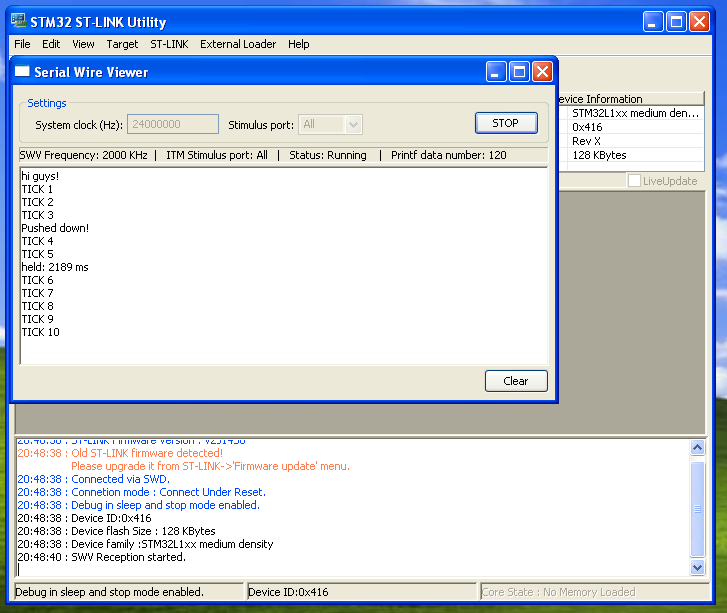
In Part 1, we set up some (very) basic code that writes out data via Stimulus Channel 0 of the ITM to be streamed otu over SWO/SWV, but we used the existing ST provided windows tool, “STLink” to be view the stream. Now let’s do it in linux.
OpenOCD has some very draft support for collecting this data, but it’s very rough around the edges. [1]
I wrote a tool based on my own decoding of USB traffic to be a little more flexible. You connect to the STLink hardware, and can start/stop logging, change trace files, and change which stimulus ports are enabled. It is quite rough, but functional. It should not be underestimated how important being able to start/stop tracing is. In the ARM debug docs, turning on or reconfiguring trace is undefined as far as having the output bitstream be properly synced. (Section D4.4 of “Flush of trace data at the end of operation” in the Coresight Architecture spec, and most importantly, “C1.10.4 Asynchronous Clock Prescaler Register, TPIU_ACPR” in the ARMv7M architecture reference manual)
Don’t get me wrong, although my tool works substantially better than OpenOCD does, it’s still very rough around the edges. Just for starters, you don’t have debug or flash at the same time! Having it integrated well into OpenOCD (or pyOCD?) is definitely the desired end goal here.
Oh yeah, and if your cpu clock isn’t 24MHz, like the example code from Part 1, then you must edit DEFAULT_CPU_HZ in the top of hack.py!
So, how do you use it?
First, get the source from github: https://github.com/karlp/swopy. You need pyusb 1.x, then run it, and type connect
karlp@tera:~/src/swopy (master)$ python hack.py
:( lame py required :(
(Cmd) connect
STLINK v2 JTAG v14 API v2 SWIM v0, VID 0x483 PID 0x3748
DEBUG:root:Get mode returned: 1
DEBUG:root:CUrrent saved mode is 1
DEBUG:root:Ignoring mode we don't know how to leave/or need to leave
(1682, 2053)
('Voltage: ', 2.9293697978596906)
DEBUG:root:enter debug state returned: array('B', [128, 0])
('status returned', array('B', [128, 0]))
('status is: ', 'RUNNING')
(Cmd)
Yes, there’s lots of debug. This is not for small children. You have been warned, but there is some help!
(Cmd) help Documented commands (type help): ======================================== connect raw_read_mem32 run swo_read_raw magic_sync raw_write_mem32 swo_file swo_start Undocumented commands: ====================== EOF exit leave_state raw_read_debug_reg swo_stop enter_debug help mode raw_write_debug_reg version (Cmd)
The commands of interest are swo_file, swo_start and swo_stop. So, enter a file name, and start it up…
(Cmd) swo_file blog.bin
(Cmd) swo_start 0xff
INFO:root:Enabling trace for stimbits 0xff (0b11111111)
DEBUG:root:READ DEBUG: 0xe000edf0 ==> 16842752 (0x1010000) status=0x80, unknown=0x0
DEBUG:root:WRITE DEBUG 0xe000edfc ==> 16777216 (0x1000000) (res=array('B', [128, 0]))
DEBUG:root:READMEM32 0xe0042004/4 returned: ['0x0']
DEBUG:root:WRITEMEM32 0xe0042004/4 ==> ['0x27']
DEBUG:root:WRITEMEM32 0xe0040004/4 ==> ['0x1']
DEBUG:root:WRITEMEM32 0xe0040010/4 ==> ['0xb']
DEBUG:root:STOP TRACE
DEBUG:root:START TRACE (buffer= 4096, hz= 2000000)
DEBUG:root:WRITEMEM32 0xe00400f0/4 ==> ['0x2']
DEBUG:root:WRITEMEM32 0xe0040304/4 ==> ['0x0']
DEBUG:root:WRITEMEM32 0xe0000fb0/4 ==> ['0xc5acce55']
DEBUG:root:WRITEMEM32 0xe0000e80/4 ==> ['0x10005']
DEBUG:root:WRITEMEM32 0xe0000e00/4 ==> ['0xff']
DEBUG:root:WRITEMEM32 0xe0000e40/4 ==> ['0xff']
DEBUG:root:READMEM32 0xe0001000/4 returned: ['0x40000000']
DEBUG:root:WRITEMEM32 0xe0001000/4 ==> ['0x40000400']
DEBUG:root:READMEM32 0xe000edf0/4 returned: ['0x1010000']
DCB_DHCSR == 0x1010000
(Cmd) rDEBUG:root:reading 16 bytes of trace buffer
DEBUG:root:Wrote 16 trace bytes to file: blog.bin
unDEBUG:root:reading 16 bytes of trace buffer
DEBUG:root:Wrote 16 trace bytes to file: blog.bin
DEBUG:root:reading 16 bytes of trace buffer
DEBUG:root:Wrote 16 trace bytes to file: blog.bin
DEBUG:root:reading 16 bytes of trace buffer
DEBUG:root:Wrote 16 trace bytes to file: blog.bin
DEBUG:root:reading 16 bytes of trace buffer
DEBUG:root:Wrote 16 trace bytes to file: blog.bin
DEBUG:root:reading 16 bytes of trace buffer
DEBUG:root:Wrote 16 trace bytes to file: blog.bin
DEBUG:root:reading 16 bytes of trace buffer
DEBUG:root:Wrote 16 trace bytes to file: blog.bin
DEBUG:root:reading 16 bytes of trace buffer
DEBUG:root:Wrote 16 trace bytes to file: blog.bin
DEBUG:root:reading 16 bytes of trace buffer
DEBUG:root:Wrote 16 trace bytes to file: blog.bin
DEBUG:root:reading 18 bytes of trace buffer
DEBUG:root:Wrote 18 trace bytes to file: blog.bin
Ok, great. but… where’d it go? Well. It’s in the native binary ARM CoreSight trace format, like so…
karlp@tera:~/src/swopy (master *)$ tail -f blog.bin | hexdump -C
00000000  01 54 01 49 01 43 01 4b  01 20 01 37 01 31 01 38  |.T.I.C.K. .7.1.8|
00000010  01 0d 01 0a 01 54 01 49  01 43 01 4b 01 20 01 37  |.....T.I.C.K. .7|
00000020  01 31 01 39 01 0d 01 0a  01 54 01 49 01 43 01 4b  |.1.9.....T.I.C.K|
00000030  01 20 01 37 01 32 01 30  01 0d 01 0a 01 54 01 49  |. .7.2.0.....T.I|
00000040  01 43 01 4b 01 20 01 37  01 32 01 31 01 0d 01 0a  |.C.K. .7.2.1....|
00000050  01 54 01 49 01 43 01 4b  01 20 01 37 01 32 01 32  |.T.I.C.K. .7.2.2|
00000060  01 0d 01 0a 01 54 01 49  01 43 01 4b 01 20 01 37  |.....T.I.C.K. .7|
00000070  01 32 01 33 01 0d 01 0a  01 54 01 49 01 43 01 4b  |.2.3.....T.I.C.K|
00000080  01 20 01 37 01 32 01 34  01 0d 01 0a 01 54 01 49  |. .7.2.4.....T.I|
00000090  01 43 01 4b 01 20 01 37  01 32 01 35 01 0d 01 0a  |.C.K. .7.2.5....|
000000a0  01 54 01 49 01 43 01 4b  01 20 01 37 01 32 01 36  |.T.I.C.K. .7.2.6|
000000b0  01 0d 01 0a 01 54 01 49  01 43 01 4b 01 20 01 37  |.....T.I.C.K. .7|
000000c0  01 32 01 37 01 0d 01 0a  01 54 01 49 01 43 01 4b  |.2.7.....T.I.C.K|
000000d0  01 20 01 37 01 32 01 38  01 0d 01 0a 01 50 01 75  |. .7.2.8.....P.u|
000000e0  01 73 01 68 01 65 01 64  01 20 01 64 01 6f 01 77  |.s.h.e.d. .d.o.w|
000000f0  01 6e 01 21 01 0d 01 0a  01 54 01 49 01 43 01 4b  |.n.!.....T.I.C.K|
00000100  01 20 01 37 01 32 01 39  01 0d 01 0a 01 54 01 49  |. .7.2.9.....T.I|
00000110  01 43 01 4b 01 20 01 37  01 33 01 30 01 0d 01 0a  |.C.K. .7.3.0....|
00000120  01 68 01 65 01 6c 01 64  01 3a 01 20 01 32 01 34  |.h.e.l.d.:. .2.4|
00000130  01 35 01 32 01 20 01 6d  01 73 01 0d 01 0a 01 54  |.5.2. .m.s.....T|
00000140  01 49 01 43 01 4b 01 20  01 37 01 33 01 31 01 0d  |.I.C.K. .7.3.1..|
00000150  01 0a 01 54 01 49 01 43  01 4b 01 20 01 37 01 33  |...T.I.C.K. .7.3|
Which is ugly, but you get the idea.
This is where swodecoder.py comes in. The author of the original SWO support in OpenOCD has some code to do this too, it’s more forgiving of decoding, but more likely to make mistakes. Mine is somewhat strict on the decoding, but probably still has some bugs.
Usage is pretty simple
$ python swodecoder.py blog.bin -f
Jumping to the near the end
Not in sync: invalid byte for sync frame: 1
Not in sync: invalid byte for sync frame: 73
Not in sync: invalid byte for sync frame: 1
Not in sync: invalid byte for sync frame: 67
Not in sync: invalid byte for sync frame: 1
Not in sync: invalid byte for sync frame: 75
Not in sync: invalid byte for sync frame: 1
Not in sync: invalid byte for sync frame: 32
Not in sync: invalid byte for sync frame: 1
Not in sync: invalid byte for sync frame: 50
Not in sync: invalid byte for sync frame: 1
Not in sync: invalid byte for sync frame: 49
Not in sync: invalid byte for sync frame: 1
Not in sync: invalid byte for sync frame: 53
Not in sync: invalid byte for sync frame: 1
Not in sync: invalid byte for sync frame: 51
Not in sync: invalid byte for sync frame: 1
Not in sync: invalid byte for sync frame: 13
Not in sync: invalid byte for sync frame: 1
Not in sync: invalid byte for sync frame: 10
TICK 2154
TICK 2155
TICK 2156
TICK 2157
---snip---
TICK 2194
TICK 2195
TICK 2196
Pushed down!
held: 301 ms
Pushed down!
TICK 2197
held: 340 ms
TICK 2198
TICK 2199
Pushed down!
TICK 2200
TICK 2201
---etc---
You (hopefully) get the idea. When the writes to the stimulus ports are 8bit, swodecoder.py simply prints it to the screen. So here we have a linux implementation of the SWV viewer from the windows STLink tool. It’s got a lot of debug, and a few steps, but the pieces are all here for you to go further.
In part three, we’ll go a bit further with this, and demonstrate how SWO lets you interleave multiple streams of data, and demux it on the host side. That’s where it starts getting fun. (Hint, look at the other arguments of swodecoder.py and make 16/32bit writes to the stimulus registers)
To stop SWO capture, type “swo_stop” and press enter, or just ctrl-d, to stop trace and exit the tool.
[1] Most importantly, you can not stop/start the collection, you can only set a single file at config time, which isn’t very helpful for running a long demon. Perhaps even worse, OpenOCD is hardcoded to only enable stimulus port 0, which is a bit restrictive when you can have 32 of them, and being able to turn them on and off is one of the nice things.
